24 Mar 2023
USD Index Price Analysis: Interim hurdle comes at the 100-day SMA
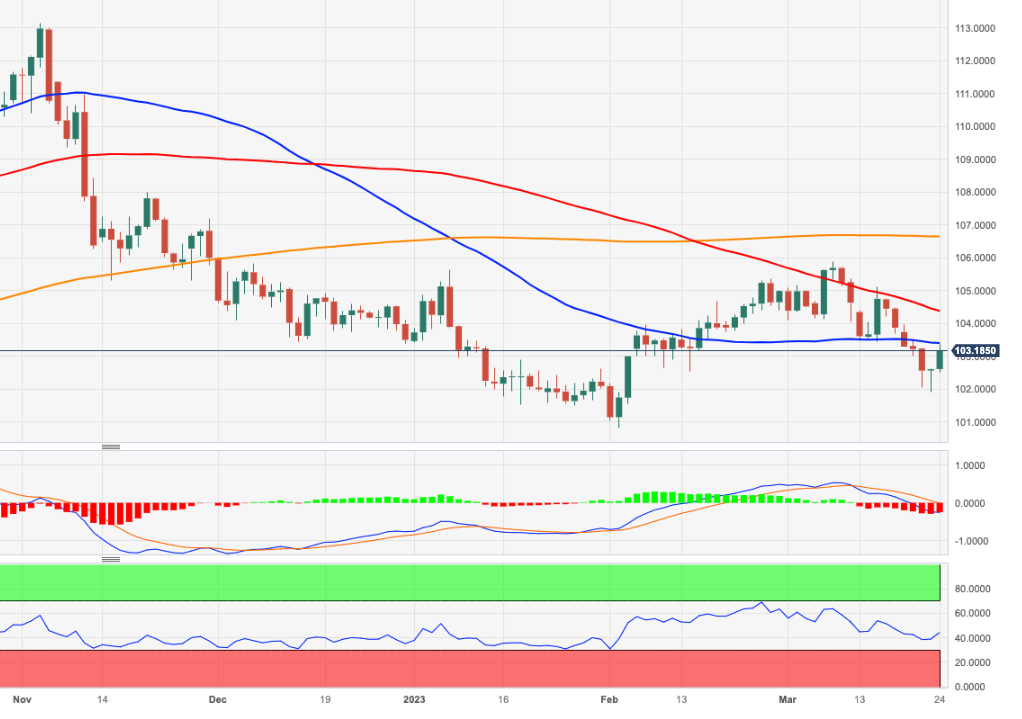
- DXY picks up further traction and surpasses the 103.00 mark.
- Further bounce could see the transitory 100-day SMA revisited.
DXY leaves behind Thursday’s lows in the sub-102.00 area and retakes the 103.00 mark on quite a convincing note.
The initial up-barrier comes at the temporary 55-day SMA near 103.40, while the continuation of the rebound is expected to meet another provisional resistance at the 100-day SMA at 104.37.
Looking at the broader picture, while below the 200-day SMA, today at 106.60, the outlook for the index is expected to remain negative.
DXY daily chart