WTI Price Analysis: Bulls remains in the game despite strong drop
- WTI price is on the back side of the channel, so that is longer-term bullish.
- WTI H4 M-formation is bullish and a break of the neckline will likely put the bias back in favour.
- Break below $76.40 will be putting on some serious heat on the committed bulls.
As per the prior analysis, the price has been in a phase of distribution for the month of December, so far, following a break of a major bear channel as the following analysis will illustrate:
WTI prior analysis
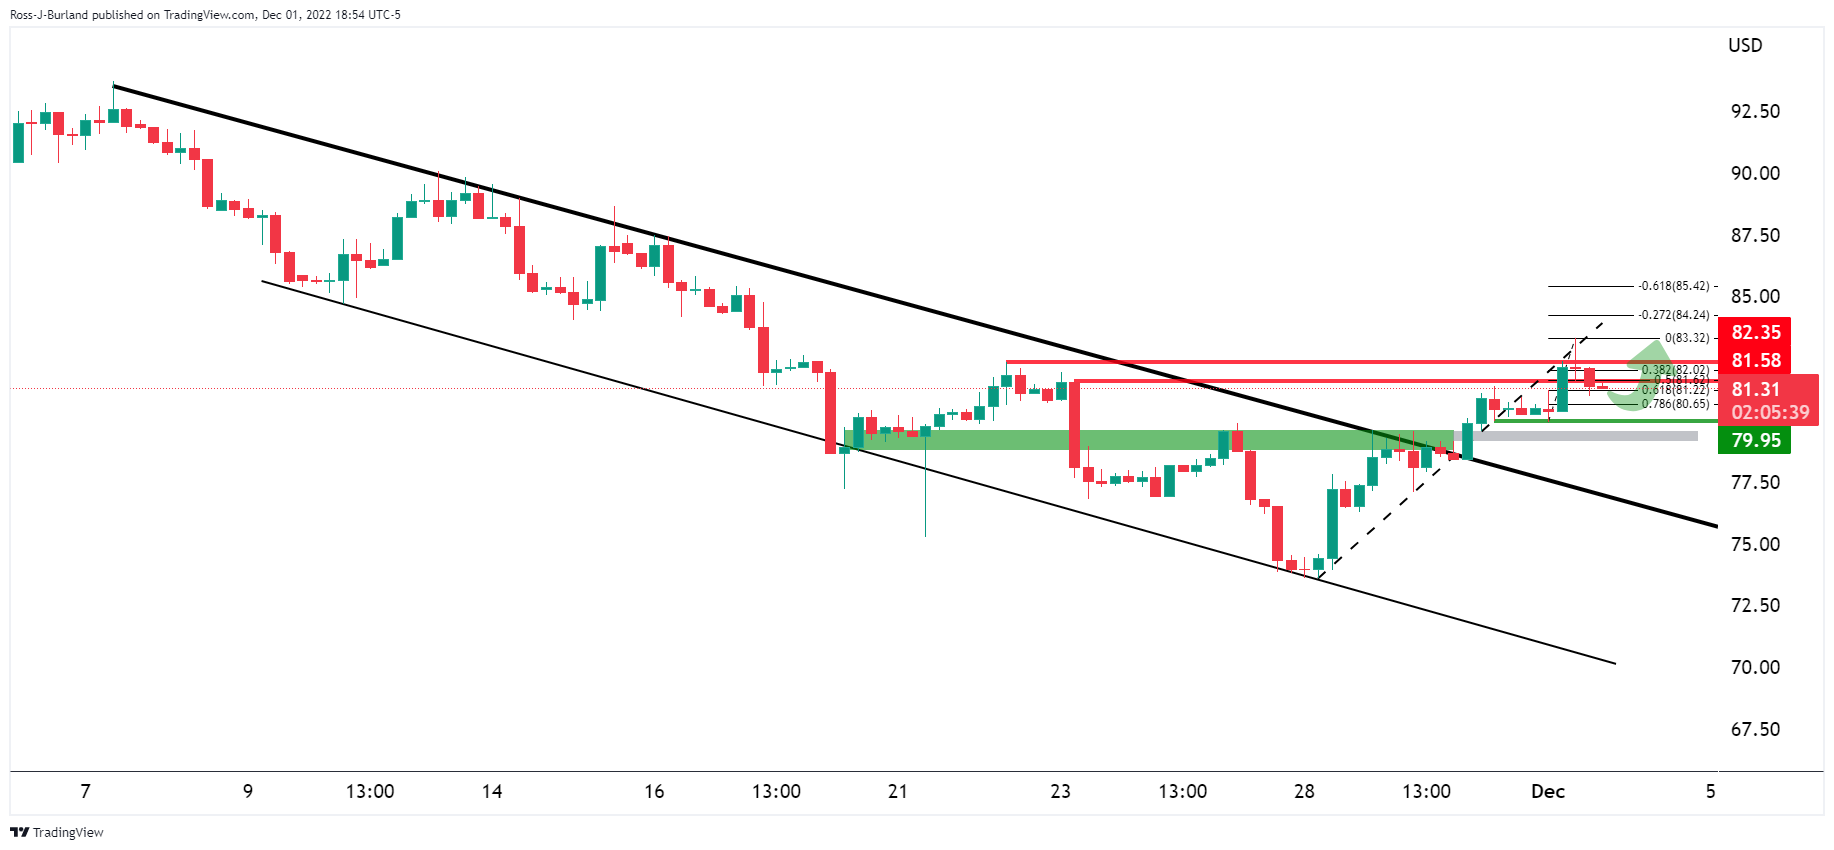
In the above daily charts, it was shown that WTI was seen moving into prior highs and this had swept liquidity where a schematic of distribution was being printed:
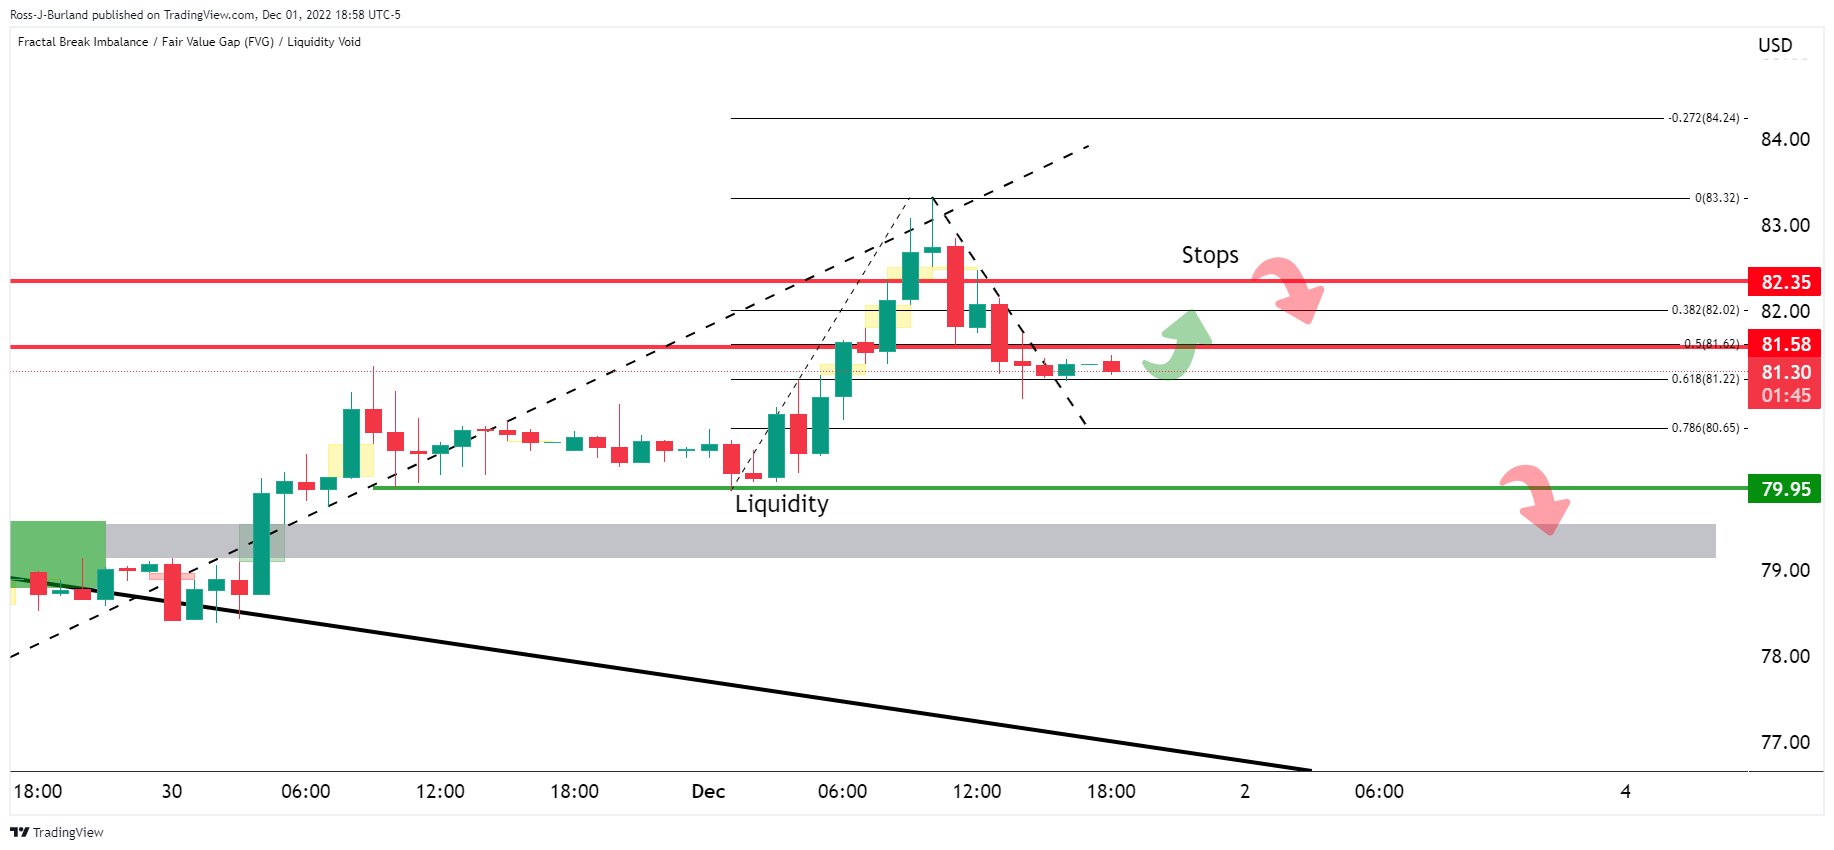
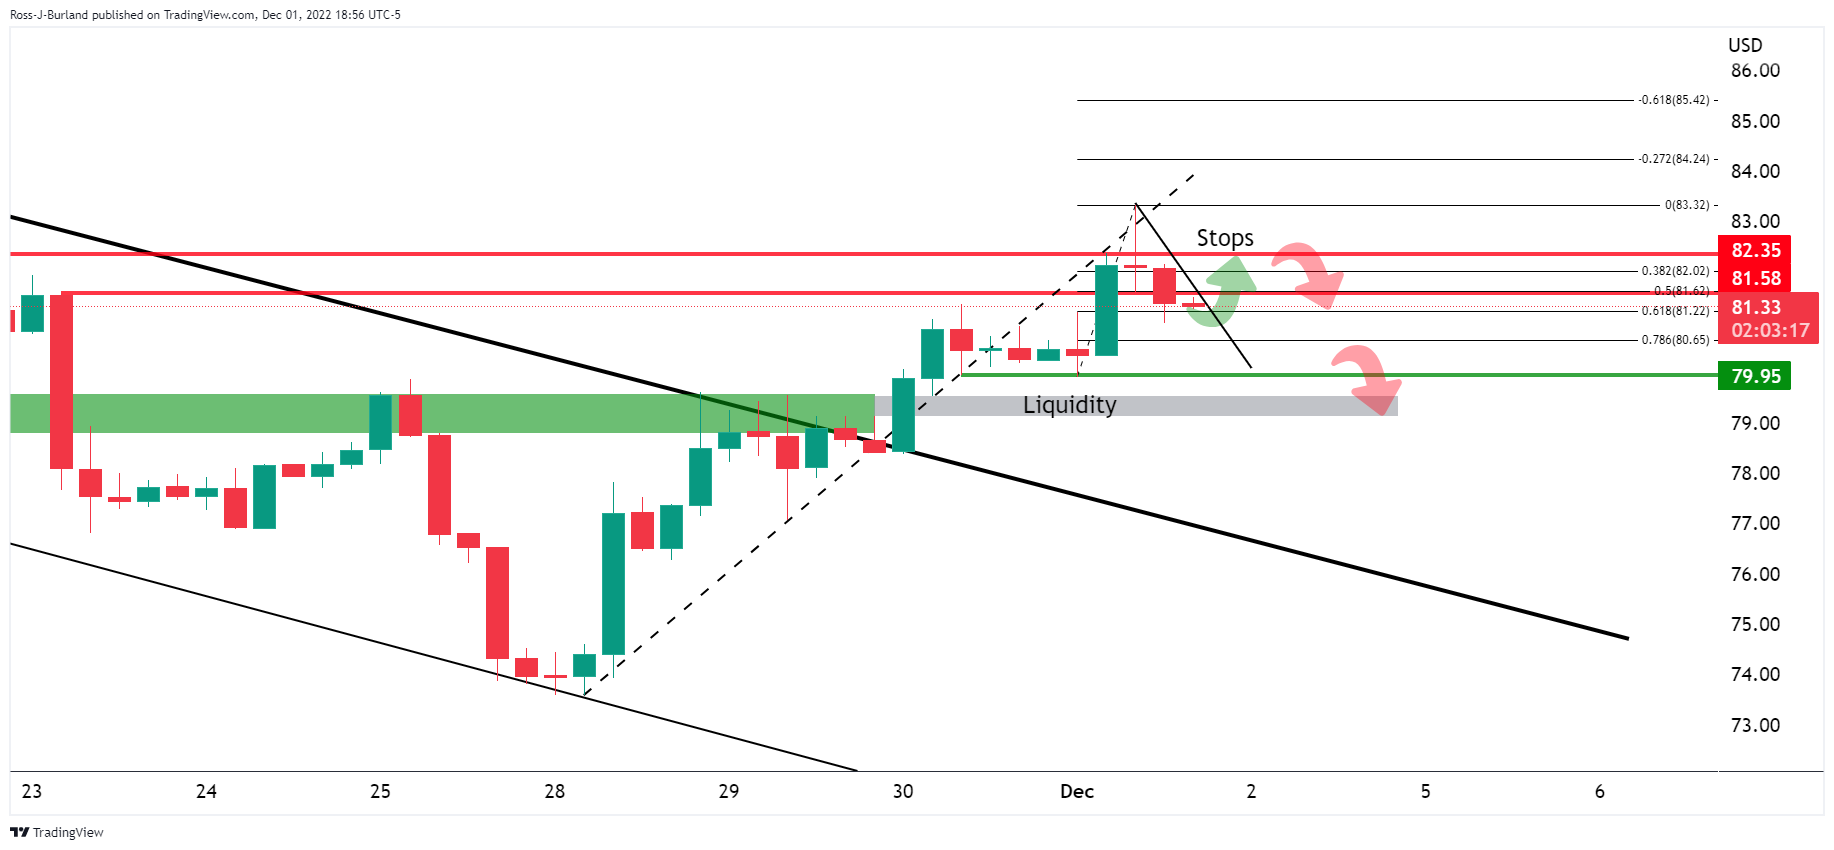
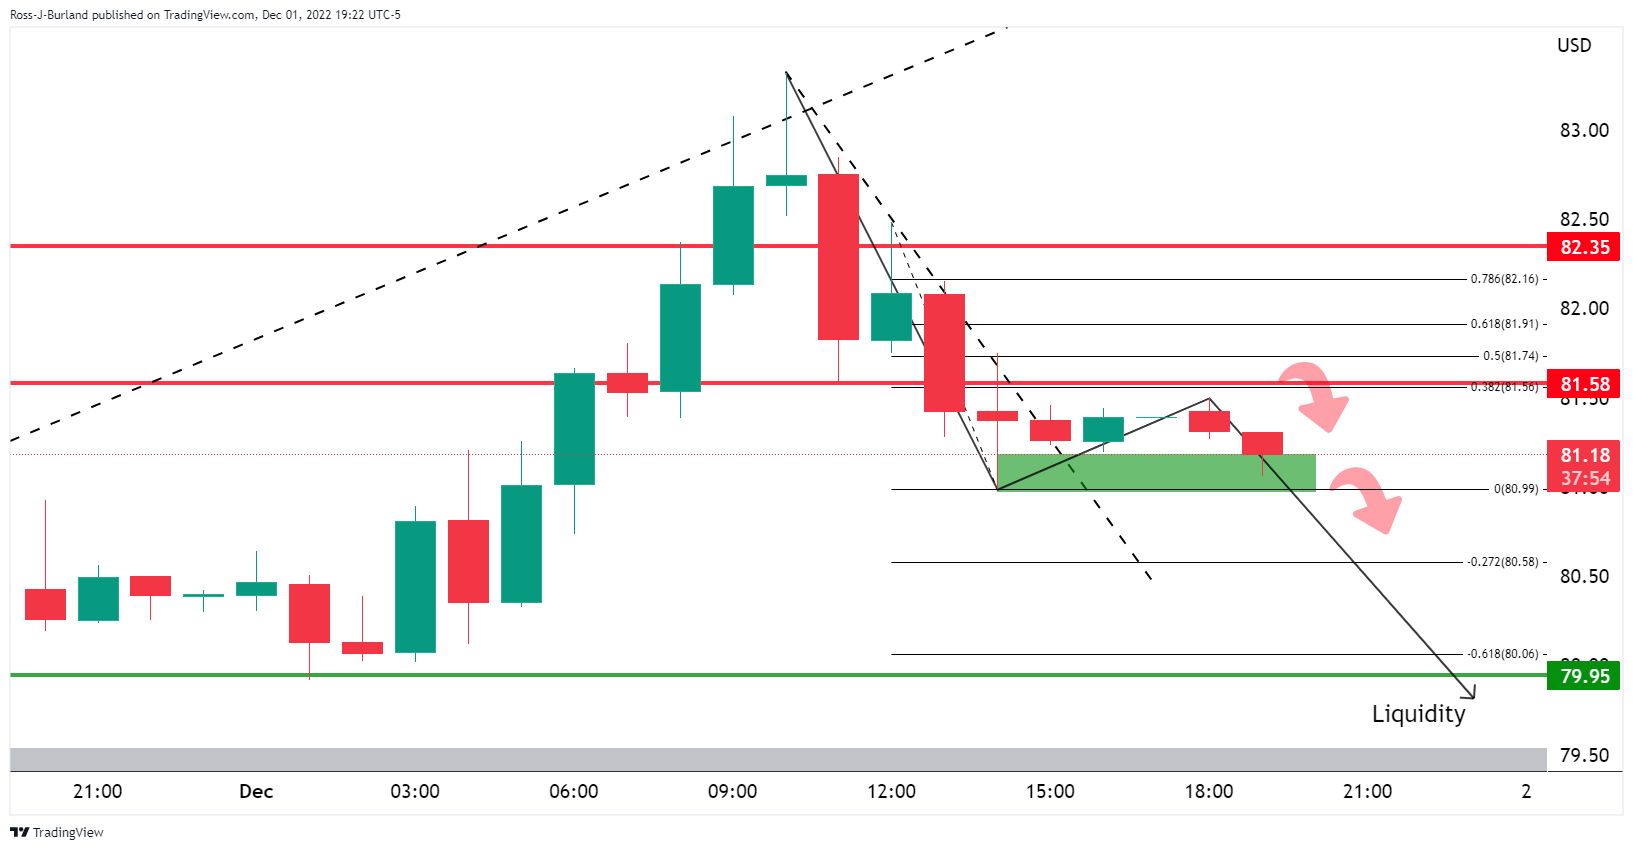
A move towards where WTI short position stops were likely located was anticipated as per the above hourly chart.
A continuation of the downside in Oil to target liquidity below $78.00 was expected eventually while below $81.50:
WTI update
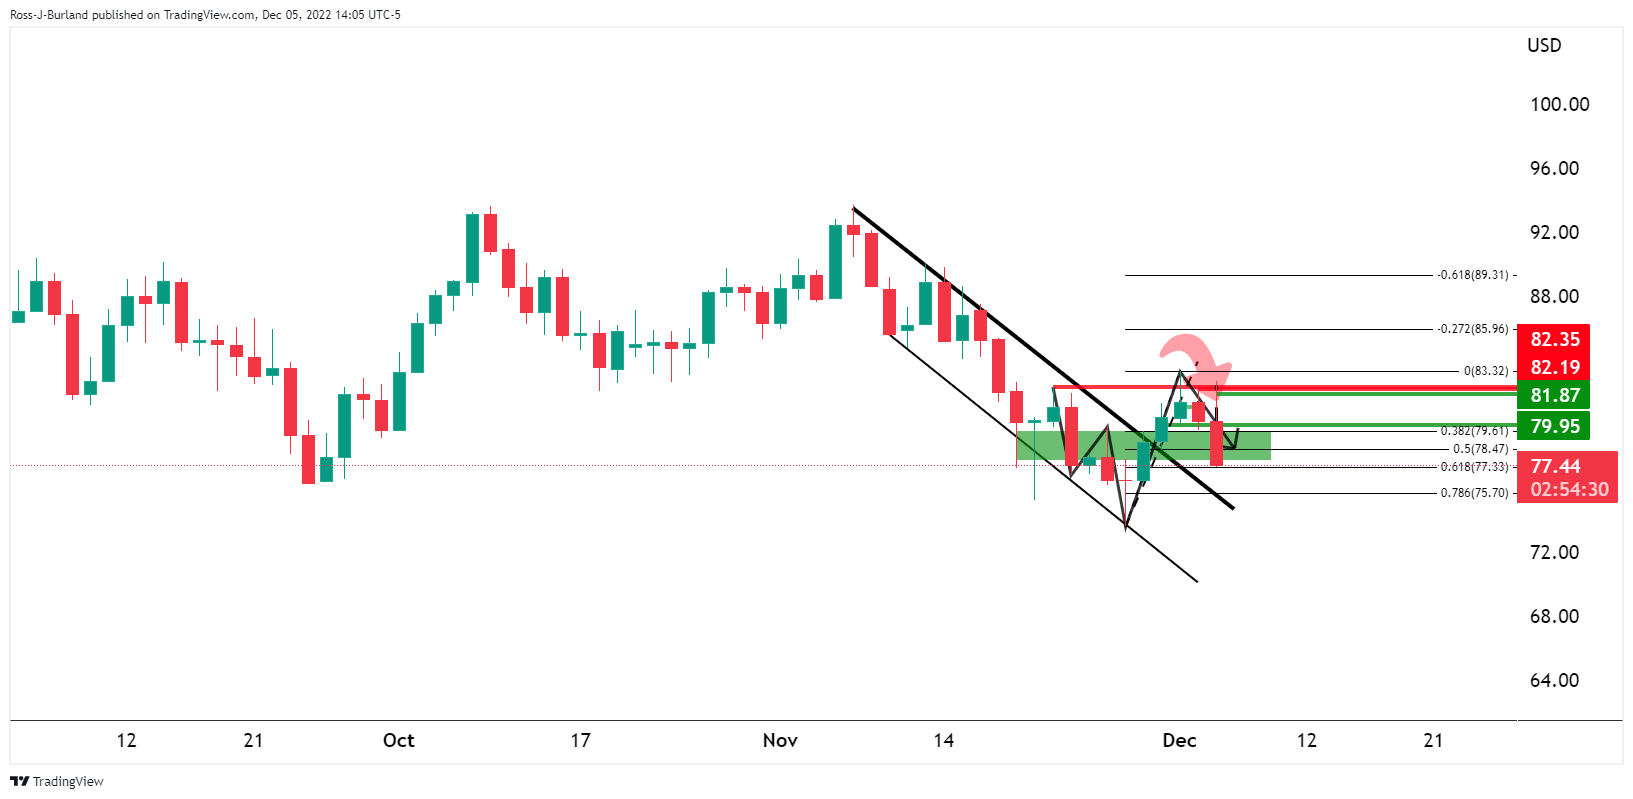
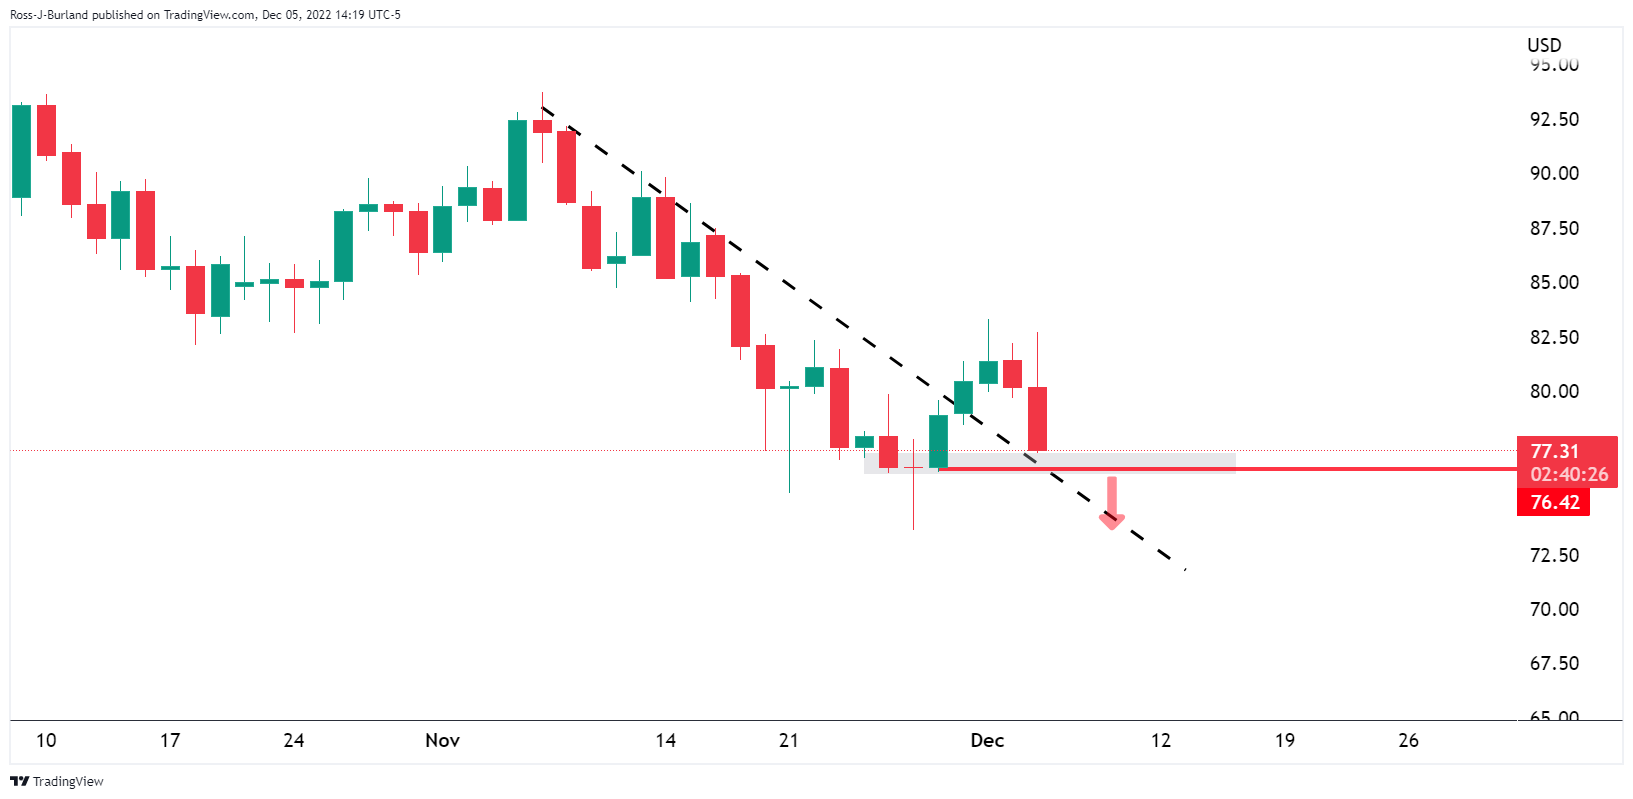
The W-formation on the daily chart has seen the price move to test the neckline.
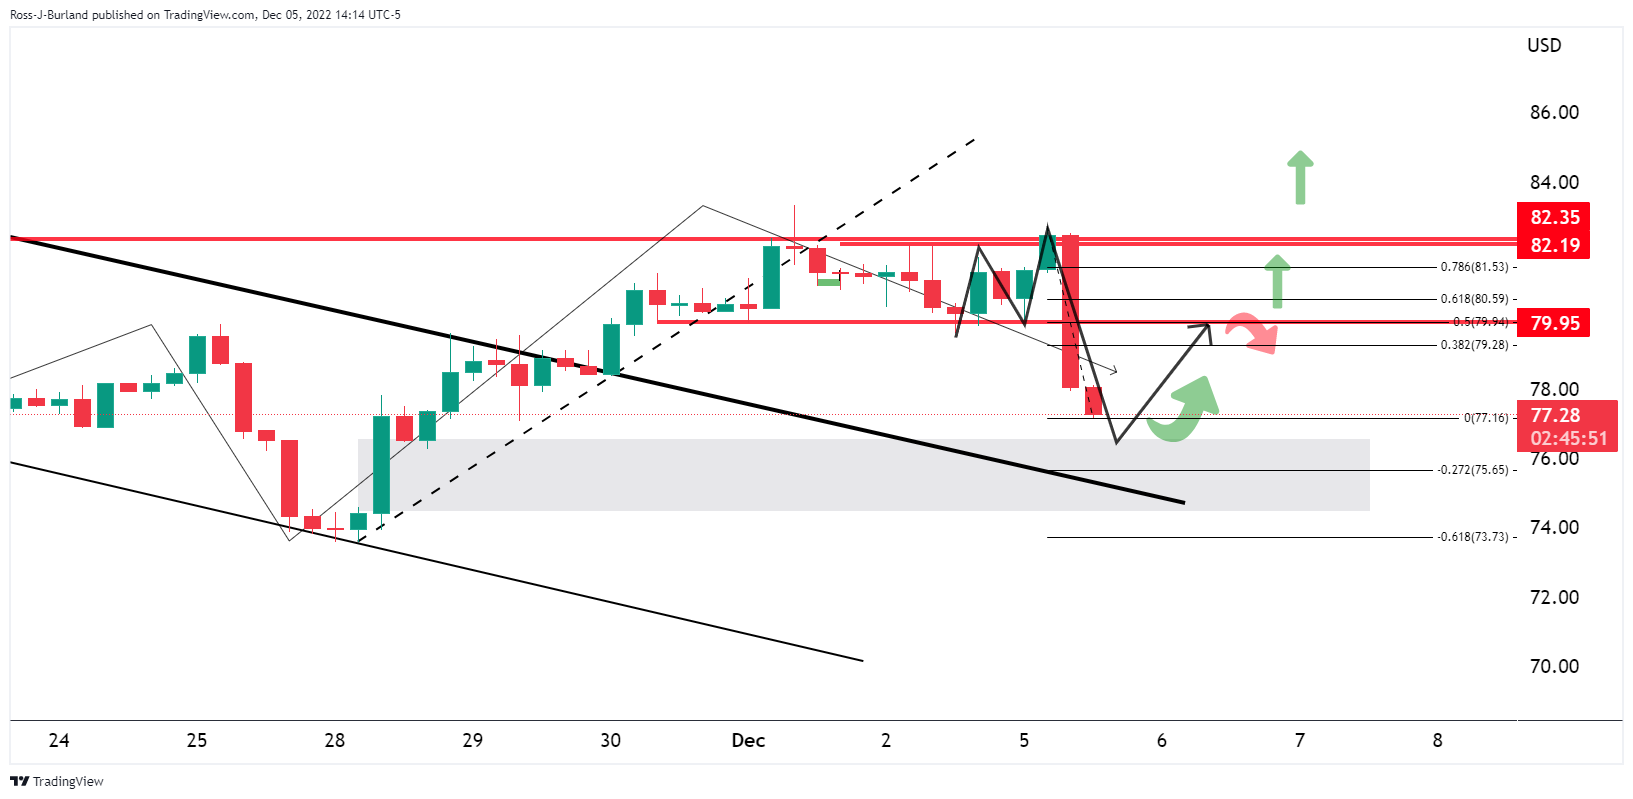
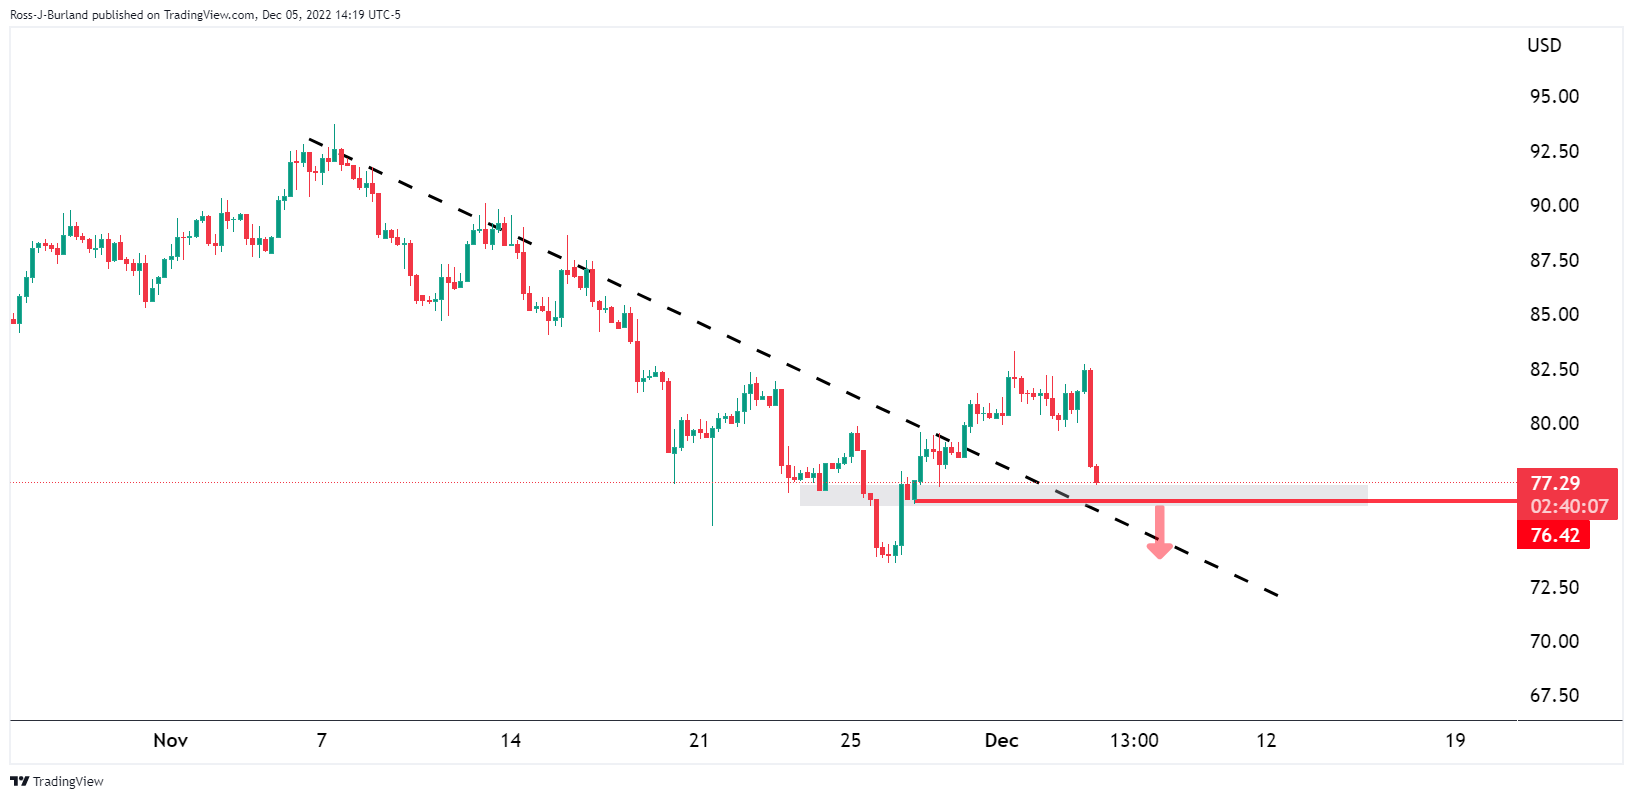
On the 4-hour chart, the M-formation is bullish and a break of the neckline, or a 50% mean reversion, will likely put the bias back in favour of the bull for a continuation higher. After all, the price is on the back side of the channel, so that is longer-term bullish. However, a break below $76.40 will be putting on some serious heat on the committed bulls as per the following daily and 4-hour charts: