WTI Price Analysis: Bullish channel defends the Oil buyers around $89.00
- WTI prints three-day uptrend inside a bullish chart formation.
- Upbeat oscillators and sustained trading beyond 50-HMA keeps buyers hopeful.
- 61.8% Fibonacci retracement level can test buyers ahead of $90.30 hurdle.
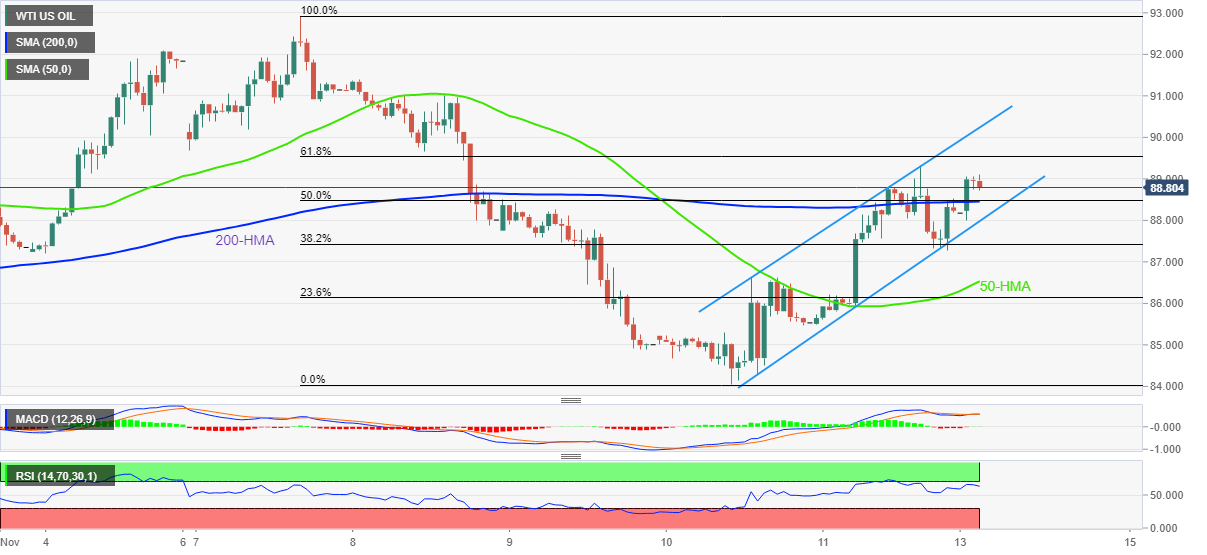
WTI remains on the front foot at around $89.00, up for the third consecutive day, as it portrays a bullish channel formation during Monday’s Asian session.
Even so, the black gold remains sidelined near the 200-HMA and 50.% Fibonacci retracement level of November 07-10 downside, close to $88.50-45.
It’s worth noting that the RSI (14) and the Moving Average Convergence and Divergence (MACD) remain in favor of commodity prices.
As a result, WTI bulls are all set to challenge the 61.8% Fibonacci retracement level, also known as the “Gold Ratio”, around $89.55.
Following that, the $90.00 psychological magnet and the stated channel’s upper line, close to $90.30, could test the oil buyers before directing them to the monthly high near $93.00.
On the contrary, $88.50-45 can restrict the short-term downside of the commodity price ahead of highlighting the channel’s lower line, at $88.00 by the press time.
Even if the WTI crude oil price drops below $88.00, the 50-HMA level near $86.50 can challenge the bears.
In a case where the crude oil remains weak past $86.50, sellers could aim for the monthly low and October trough, respectively near $84.00 and $81.30.
WTI: Hourly chart
Trend: Limited upside expected