US stocks are whipsawed around US CPI, benchmarks firmly back in the green
- US stocks rebound in midday trade despite the US CPI print.
- Bulls have stepped in at a bargain on Wall Street.
US stocks are roaring back into positive territory, putting on a short squeeze following the pre-market and opening sell-off that ensued on the back of red-hot Consumer Price Index data. Stocks plunged to lows for the year but bulls moved in at a big discount, sending the Dow Jones and S&P 500 higher by as much as 2% at one point.
Red hot US CPI
Trading was dominated by the release of consumer price figures:
- US CPI (MoM) Sep: 0.4% (est 0.2%; prev 0.1%).
- US CPI (Y0Y) Sep: 8.2% (est 8.1%; prev 8.3%).
- US CPI Core (M0M) Sep: 0.6% (est 0.2%; prev 0.6%).
- US CPI Core (Y0Y) Sep: 6.6% (est 6.5%; prev 6.3%).
Core CPI gained at its highest annual pace in 40 years, rising 0.6% for the month and 6.6% for the year and Fed funds futures are now pricing in 75 bps in December, up from 50. Moreover, terminal rate expectations rose to 4.85% in March. As a consequence, the 10-year Treasury yield rallied to 4.080% while the 2-year yield was up to 4.535%.
The report follows data on Wednesday that showed US producer prices increased more than expected in September and combined with CPI, traders in the money markets are pricing in a near 91% odds of a fourth straight 75-basis-point hike by the Fed at its meeting next month, with some also pricing in a 9% chance of a 100 bps rise.
Nevertheless, some price discovery is coming into the markets ahead of the third-quarter earnings at the end o the week while the indexes trail along the bottom of a 50% correction of the March 2020 rally. At 1.33 p.m. ET, the Dow Jones Industrial Average was up 851 points, or 2.93%, at 30,062 and had recovered from the low of the day down at 28,660.94. The S&P 500 was up 93.80 points to 2.62% while the Nasdaq Composite was up 253 points, or 2.34%%, at 11,037.
S&P 500 weekly chart
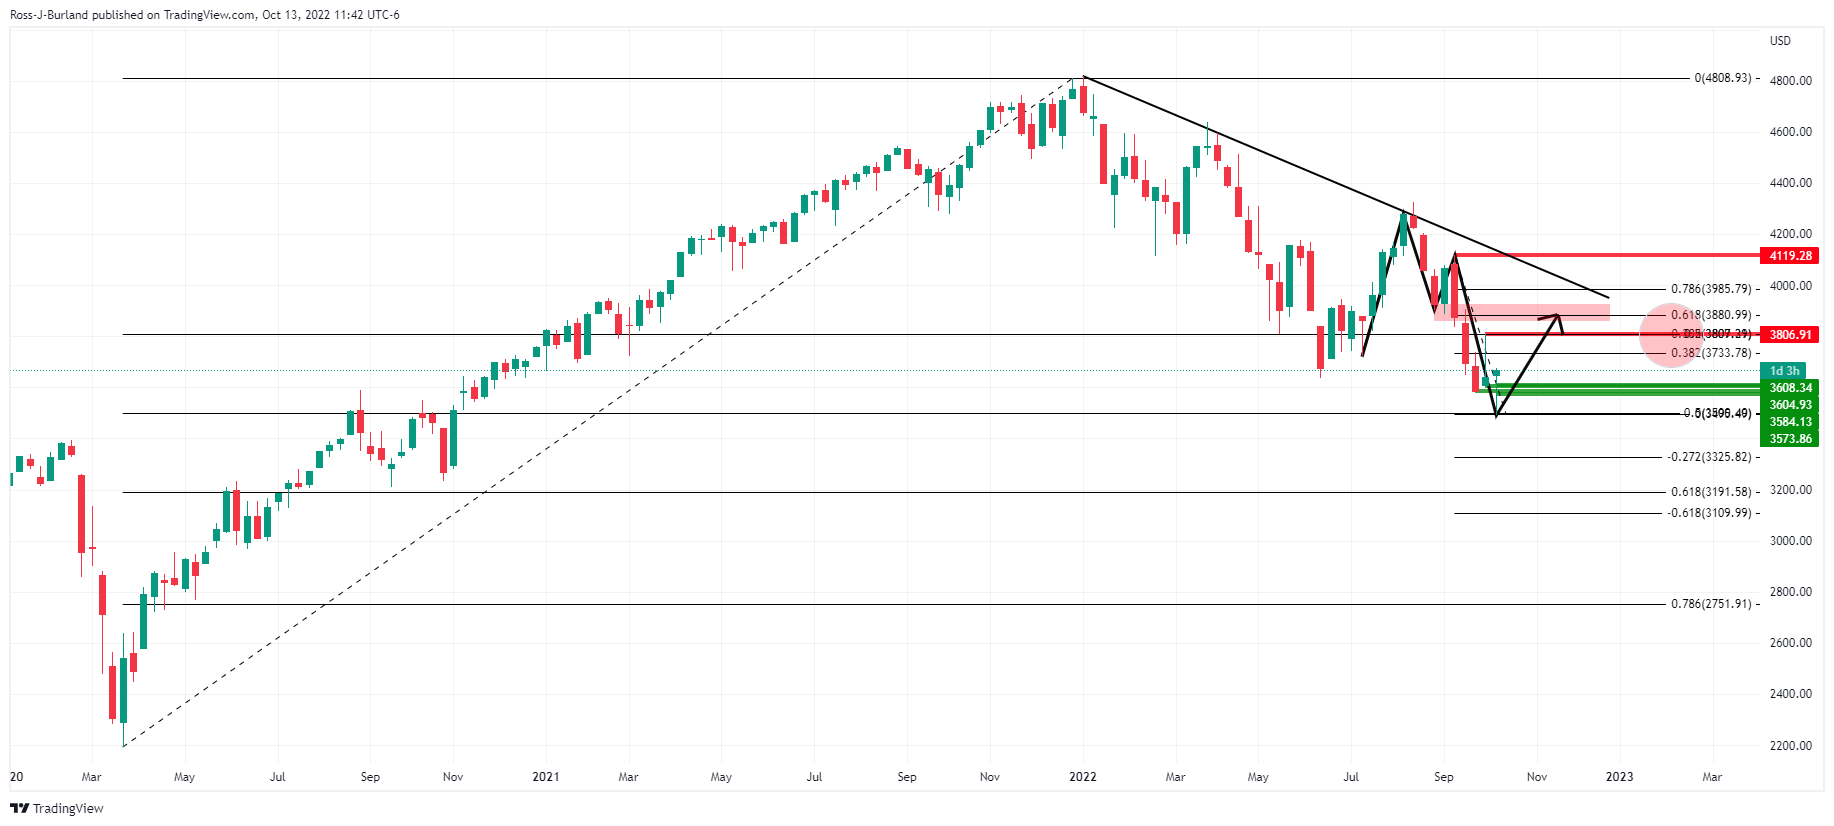
At a 50% mark of the March 2020 bull market, the index is carving out an M-formation that would be respected to see the market move in on the neckline with a 50% mean reversion falling in at the month's highs so far near 3,806.